UPDATE: The unofficial results have been updated as returns are coming in. The post has been updated to reflect the new unofficial stats.
While ballots may still be counted for the next 10 days, as mail arrives, here are the unofficial counts from Bergen County for Teaneck.
Official Link to updated results (11/4/20)
Official Link to results (11/3/20)

Here is a breakdown of turnout by district. I made this based on information received from the County. It’s subject to change and I can’t verify the accuracy of the information. It also may not count those recently registered to vote. But, it’s the best I have at the moment.
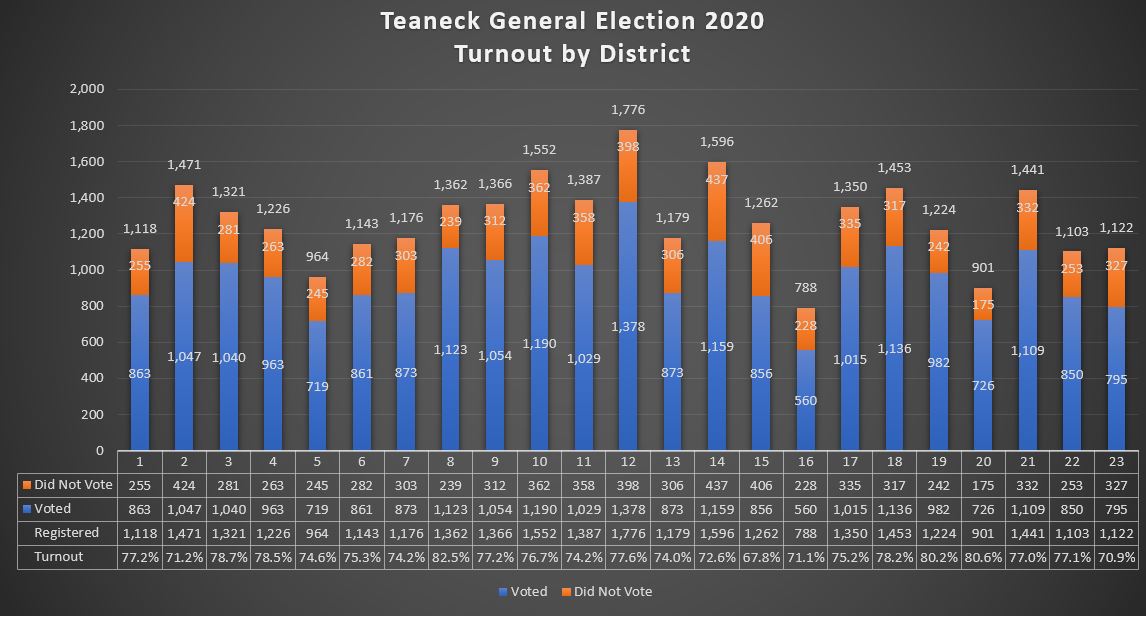
| District | Voted | Registered | Turnout |
| 1 | 863 | 1,118 | 77.2% |
| 2 | 1,047 | 1,471 | 71.2% |
| 3 | 1,040 | 1,321 | 78.7% |
| 4 | 963 | 1,226 | 78.5% |
| 5 | 719 | 964 | 74.6% |
| 6 | 861 | 1,143 | 75.3% |
| 7 | 873 | 1,176 | 74.2% |
| 8 | 1,123 | 1,362 | 82.5% |
| 9 | 1,054 | 1,366 | 77.2% |
| 10 | 1,190 | 1,552 | 76.7% |
| 11 | 1,029 | 1,387 | 74.2% |
| 12 | 1,378 | 1,776 | 77.6% |
| 13 | 873 | 1,179 | 74.0% |
| 14 | 1,159 | 1,596 | 72.6% |
| 15 | 856 | 1,262 | 67.8% |
| 16 | 560 | 788 | 71.1% |
| 17 | 1,015 | 1,350 | 75.2% |
| 18 | 1,136 | 1,453 | 78.2% |
| 19 | 982 | 1,224 | 80.2% |
| 20 | 726 | 901 | 80.6% |
| 21 | 1,109 | 1,441 | 77.0% |
| 22 | 850 | 1,103 | 77.1% |
| 23 | 795 | 1,122 | 70.9% |
| Total | 22,201 | 29,281 | 75.8% |
| Voted | Registered | Turnout | |
| Dem | 13,419 | 16,320 | 82.2% |
| Rep | 2,933 | 3,721 | 78.8% |
| Una | 5,710 | 8,987 | 63.5% |
| 22,062 | 29,281 | 75.3% |
For a more up to date list of turnout by district using registration data through the October deadline and ballots received through 11/5 see http://teaneck.info/General2020/Turnout%20as%20of%2011-5-2020.htm
Note the tabs at the bottom also show turnout by age, party, and date ballots were received.
Thanks, Tom.
I’ve also updated the post so it’s now more recent than your data – looking forward to your next post.