Population Data
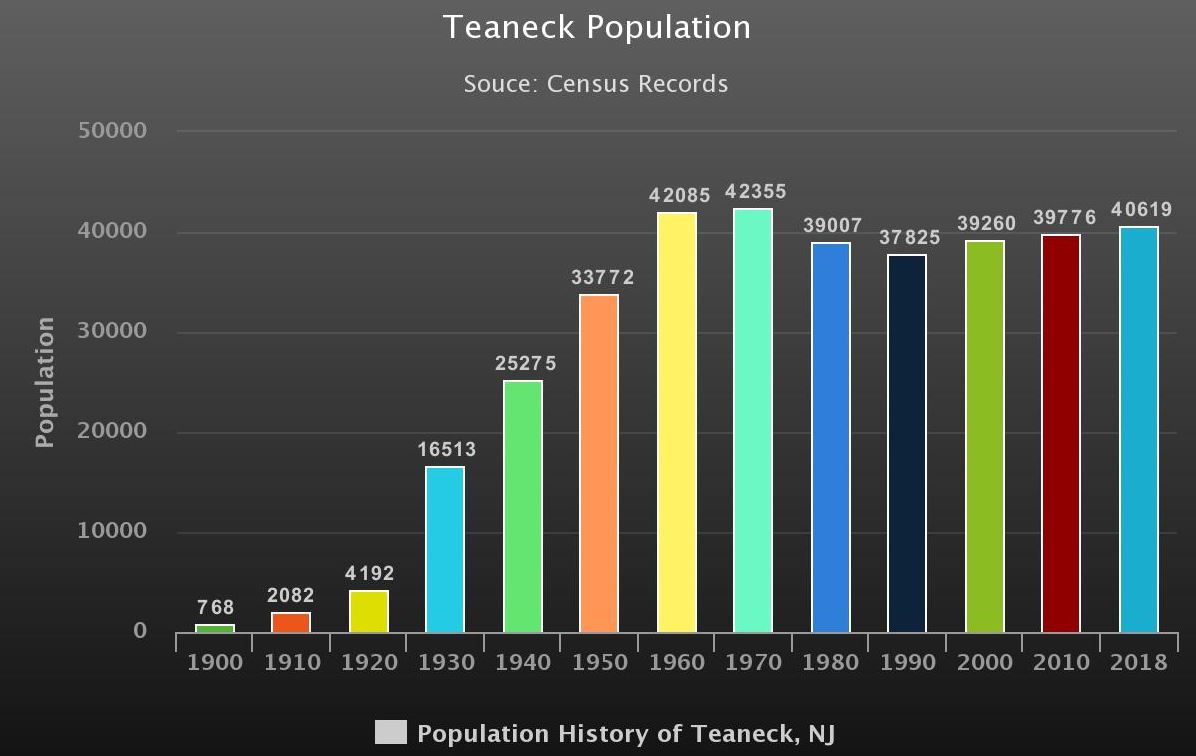
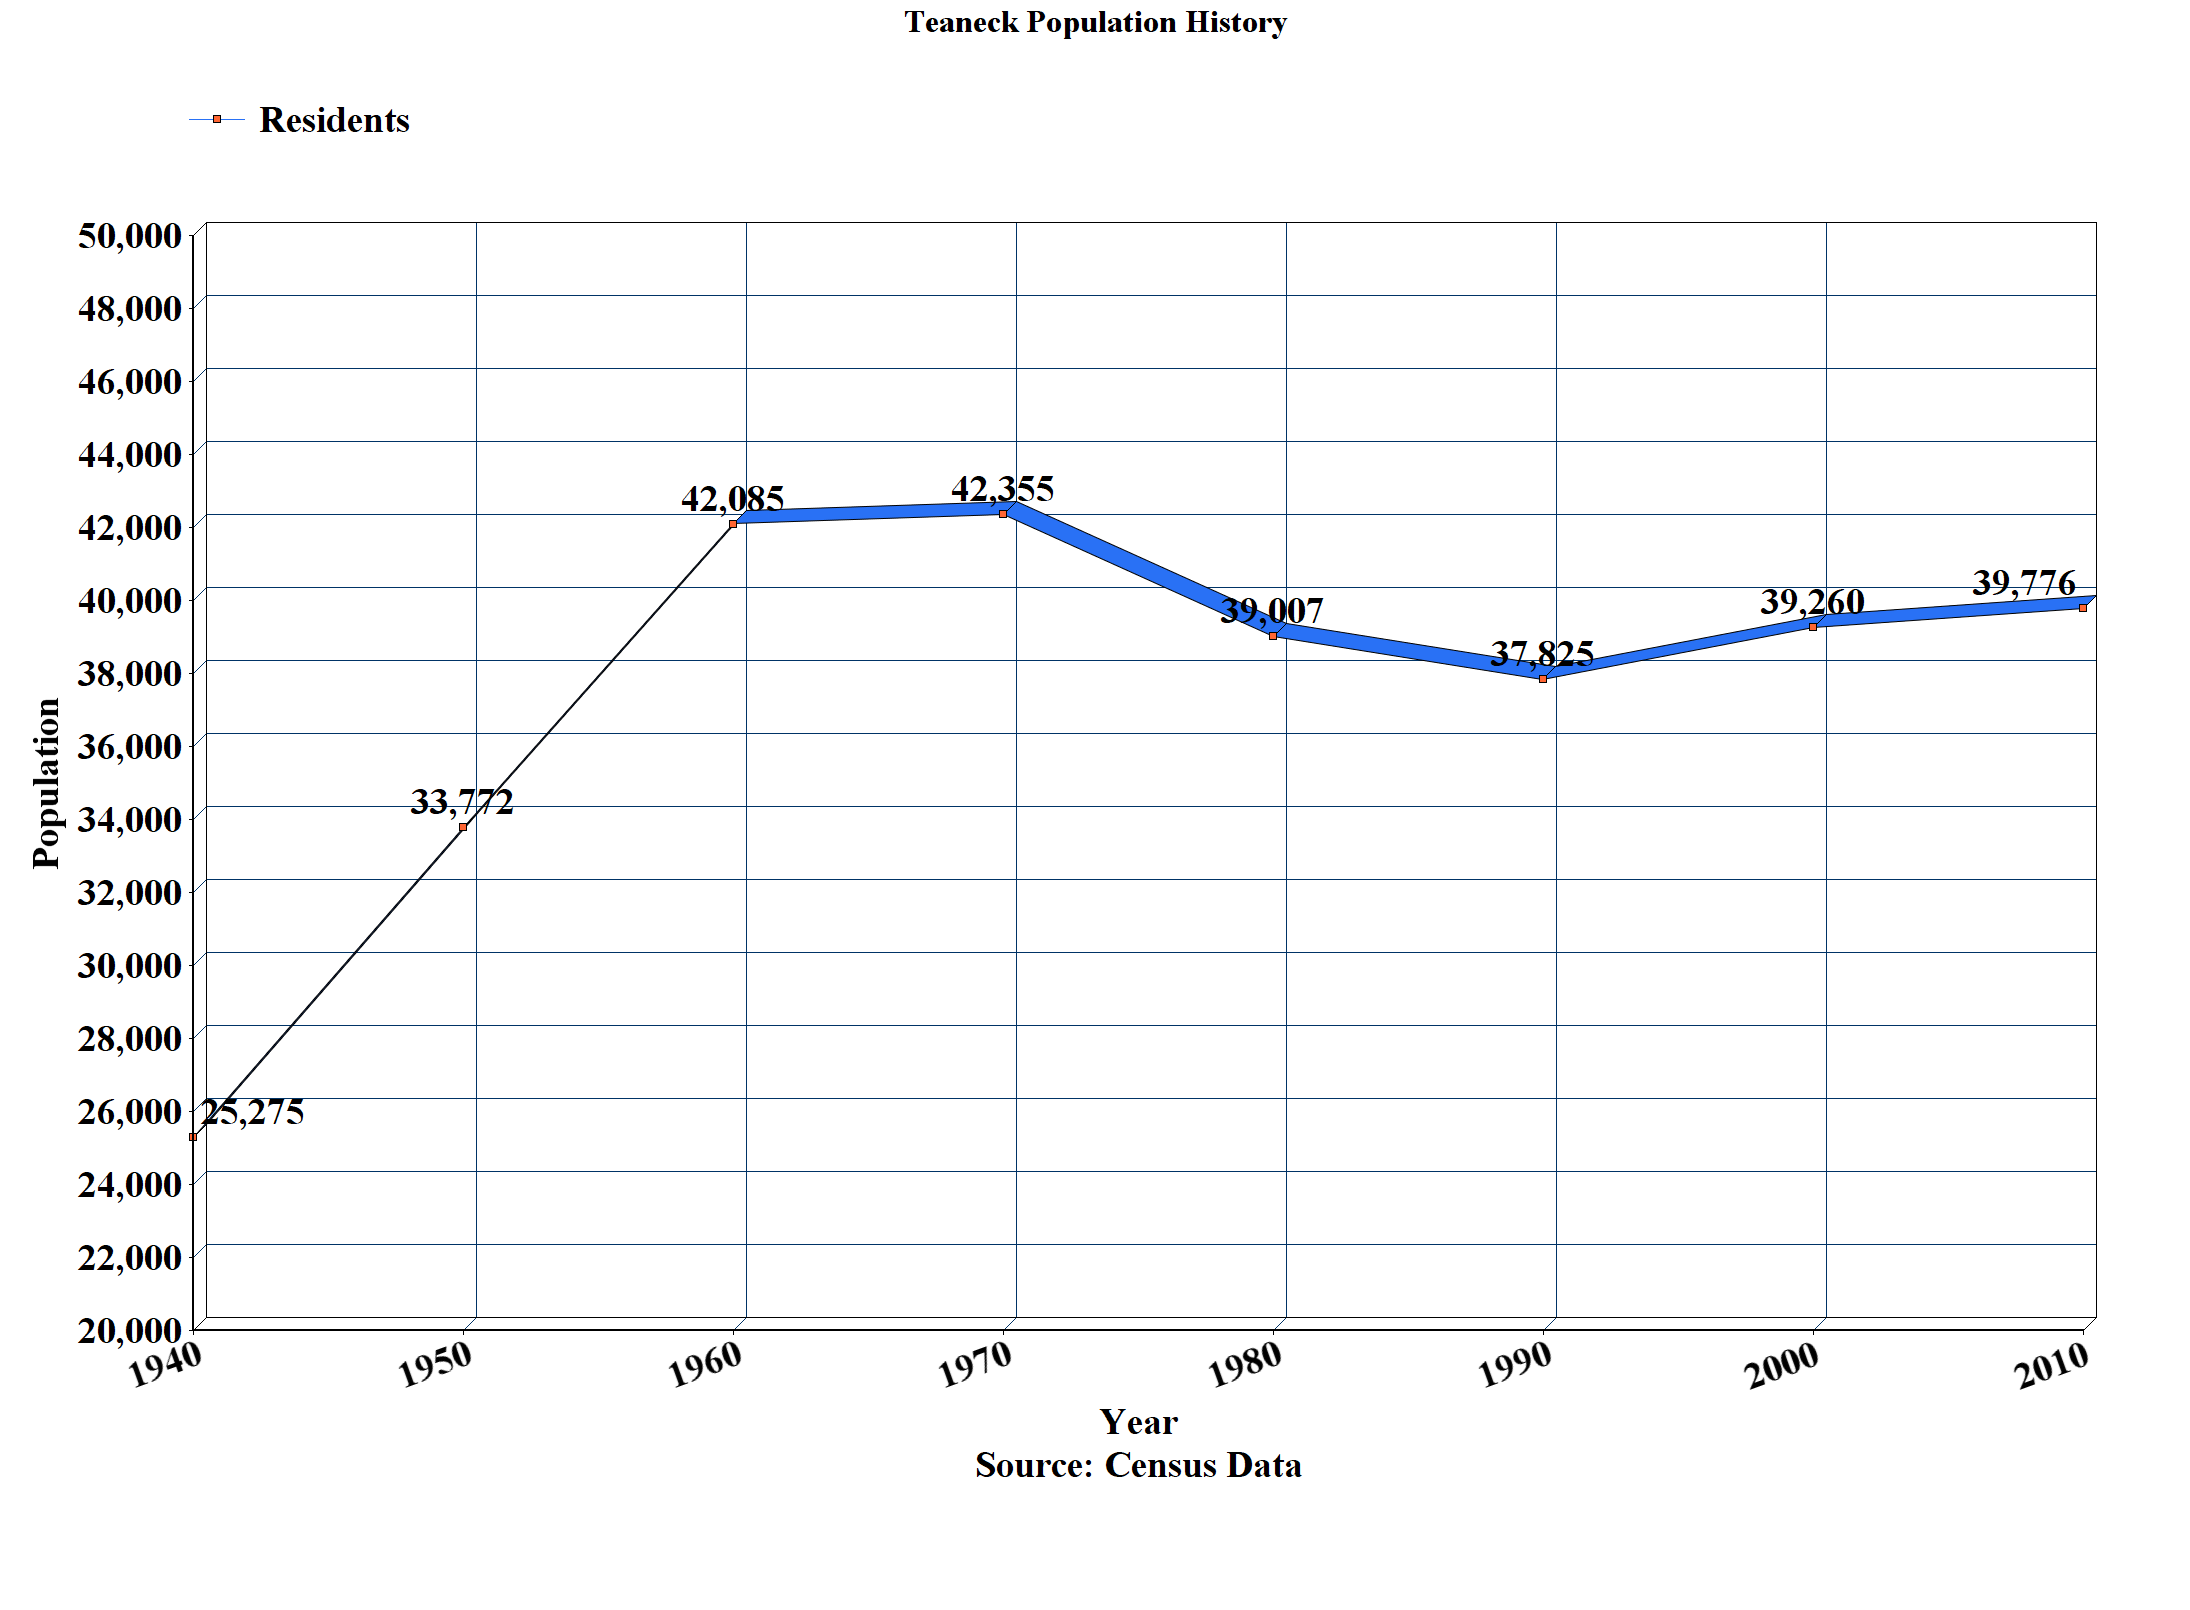
We’ll get a better sense after the 2020 Census, but here are our population data (by decade).
(↑) indicated an increase over the prior decade
(↓) indicates a decrease over prior decade
| Decade | Population | Change from prior decade (%) | Change from prior decade (#) |
| 2020 | 41,246 (↑) | 103.70% | + 1,470 |
| 2010 | 39,776 (↑) | 101.31% | + 516 |
| 2000 | 39,260 (↑) | 103.79% | + 1,435 |
| 1990 | 37,825 (↓) | 96.97% | – 1,182 |
| 1980 | 39,007 (↓) | 92.10% | – 3,348 |
| 1970 | 42,355 (↑) | 100.64% | + 270 |
| 1960 | 42,085 (↑) | 124.62% | + 8,313 |
| 1950 | 33,772 (↑) | 133.62% | + 8,497 |
| 1940 | 25,275 (↑) | 153.06% | + 8,762 |
| 1930 | 16,513 (↑) | 393.92% | +12,321 |
| 1920 | 4,192 (↑) | 201.34% | + 2,110 |
| 1910 | 2,082 (↑) | 271.09% | + 1,314 |
| 1900 | 768 |
(* 2018 figure is an estimate from census.gov)